01 · Free
Retrospective scan
How Khora would have ranked your territory from 2016 data, checked against what was actually built from 2021 to 2025. You see how it does on ground you know.
FOR UTILITIES, CO-OPS, WATER SYSTEMS AND SCHOOL DISTRICTS
Khora ranks 900-meter cells in your service territory to highlight where new pavement and buildings may emerge. Your planners start with the top 5–10% instead of the whole map.
A clearer starting point for the places you plan.
 Explore in the Atlas ↗
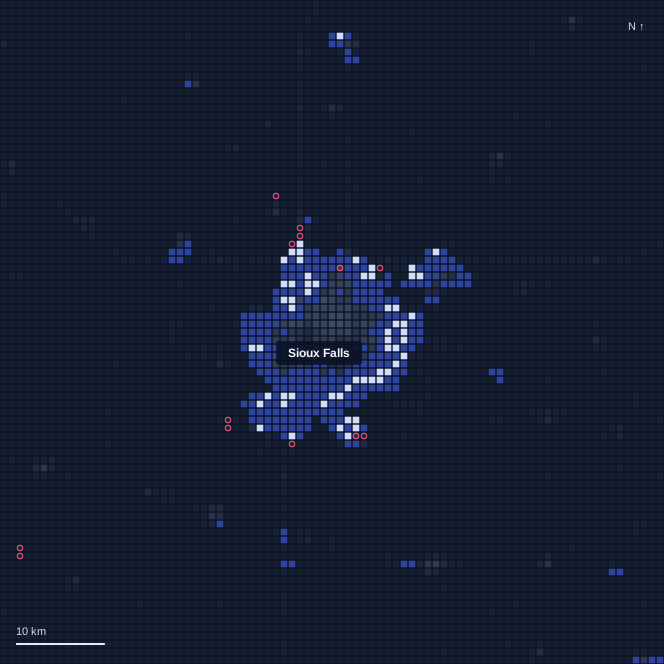
Real historical output: a 74.7 km study region in 900 m cells, with growth measured in 2021–2025.
SAME REGION, TWO SHORTLISTS
Trend-following bets on places that were already growing. Khora reads the shape of the whole settlement, so it also flags edges that had been quiet.
Explore in the Atlas ↗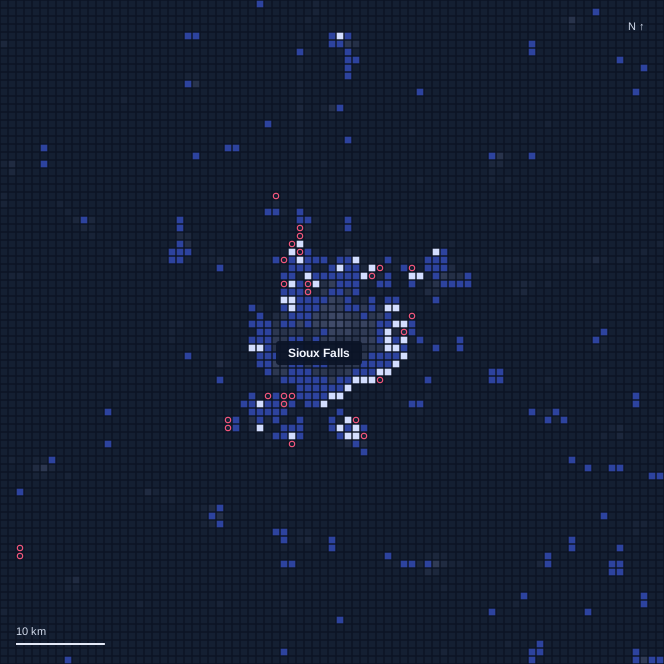 Explore in the Atlas ↗
Sioux Falls had the largest net gain in growth fronts of the 29 regions (+13). See all 29 below.
ACROSS ALL 29 REGIONS
Khora’s top 2% of cells held 40% of all growth fronts. Its top 10% held 80%. Khora found more at each search budget shown, so you can explore the one that fits your planning budget.
Share of all 597 growth fronts observed in 2021–2025 found in the top-ranked cells. Rankings use 2016 data across 29 U.S. regions. Pooled results; fractional credit at tied cutoffs.
THE HEADLINE RESULT
We ranked 29 U.S. regions from 2016 data, then counted the growth fronts that actually appeared from 2021 to 2025: 900-meter areas where pavement and buildings expanded substantially. There were 597 in total.
Bars show growth fronts found out of 597. Trend-following ranks cells by their growth over the previous five years.
REGION BY REGION
On average, Khora’s top 5% caught 73.0% of each region’s growth fronts. Trend-following caught 60.6%.
In 4 of the 9 ties, both methods caught every new front in the region. In the ten regions growing fastest before 2016 (chosen before any outcomes were seen), Khora was better in 9, tied in 1 and behind in none, by 13.6 points on average.
None of the 29 regions were used to build the model. They are mostly smaller metros (26 small, 3 large), with none in the Northeast. The high-growth subgroup is descriptive.
| Study region | Growth fronts | Khora found | Trend found | Result |
|---|---|---|---|---|
| Redding, CA ↗ | 3 | 3 | 3 | Tied |
| Flagstaff, AZ ↗ | 4 | 4 | 4 | Tied |
| Kankakee, IL ↗ | 53 | 35 | 23 | Khora better |
| Johnson City, TN ↗ | 11 | 3 | 3 | Tied |
| Grand Island, NE ↗ | 12 | 11 | 9 | Khora better |
| Tyler, TX ↗ | 13 | 5 | 6 | Trend better |
| Salisbury, MD--DE ↗ | 43 | 30 | 20 | Khora better |
| Appleton, WI ↗ | 56 | 37 | 26 | Khora better |
| Harrisonburg, VA ↗ | 9 | 7 | 4 | Khora better |
| Monroe, LA ↗ | 5 | 4 | 4 | Tied |
| Chico, CA ↗ | 12 | 8 | 5 | Khora better |
| Huntington, WV--KY--OH ↗ | 7 | 0 | 1 | Trend better |
| Parkersburg, WV--OH ↗ | 1 | 1 | 1 | Tied |
| St. George, UT ↗ | 45 | 36 | 31 | Khora better |
| Rapid City, SD ↗ | 20 | 18 | 13 | Khora better |
| Las Cruces, NM ↗ | 11 | 8 | 5 | Khora better |
| Albany, GA ↗ | 2 | 1 | 1 | Tied |
| Missoula, MT ↗ | 3 | 3 | 2 | Khora better |
| San Angelo, TX ↗ | 5 | 4 | 4 | Tied |
| Grants Pass, OR ↗ | 3 | 3 | 2 | Khora better |
| Decatur, IL ↗ | 6 | 6 | 5 | Khora better |
| Manhattan, KS ↗ | 1 | 1 | 1 | Tied |
| Grand Forks, ND--MN ↗ | 4 | 3 | 3 | Tied |
| Hinesville, GA ↗ | 59 | 25 | 21 | Khora better |
| Sioux Falls, SD ↗ | 73 | 60 | 47 | Khora better |
| Sioux City, IA--NE--SD ↗ | 10 | 8 | 6 | Khora better |
| Mobile, AL ↗ | 38 | 16 | 13 | Khora better |
| Peoria, IL ↗ | 3 | 3 | 2 | Khora better |
| Tulsa, OK ↗ | 85 | 33 | 27 | Khora better |
ONE ILLUSTRATIVE LOCATION
South of Joliet, Illinois, in our Kankakee study region, one 900-meter cell had seen essentially no growth in the five years before 2016. A trend-based ranking put it near the bottom. Khora put it near the top. Within five years it was nearly half paved or built over.
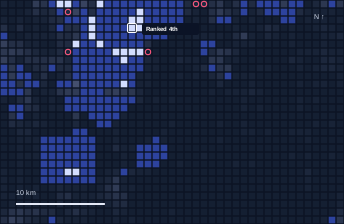
An illustrative cell, not a typical outcome. Historical rank does not establish what will happen at an individual location.
WHAT YOU GET
01 · Free
How Khora would have ranked your territory from 2016 data, checked against what was actually built from 2021 to 2025. You see how it does on ground you know.
02 · Research stage
A research-stage ranking from 2025 data, highlighting areas to investigate for development during 2030–2034, the same five-to-nine-year horizon we tested. A dated record is kept so results can be checked as they arrive.
03 · For your team
Ranked 900-meter cells with top 5% and top 10% flags, delivered as GeoJSON and CSV. Ready to overlay on your system maps, load forecasts or facility plans.
YOUR TERRITORY. A CLEARER STARTING POINT.
Tell us your service area. We’ll discuss a free retrospective scan and walk your planning team through what it found, including where it missed.
Explore settlement growth, 1985–2025, in the AtlasObserved settlement history across the contiguous United States.